What Are Raster and Vector Data
Spatiotemporal data products of TerraQuanta are basically in format of either raster data or vector data. Here is simple explanation of these two concepts:
Raster Data:
The “raster” in raster data refers to the independent grid formed by dividing the space according to a certain grid. Each grid represents a specific rectangular space with a definite size and position, and each grid is assigned a value to express some information
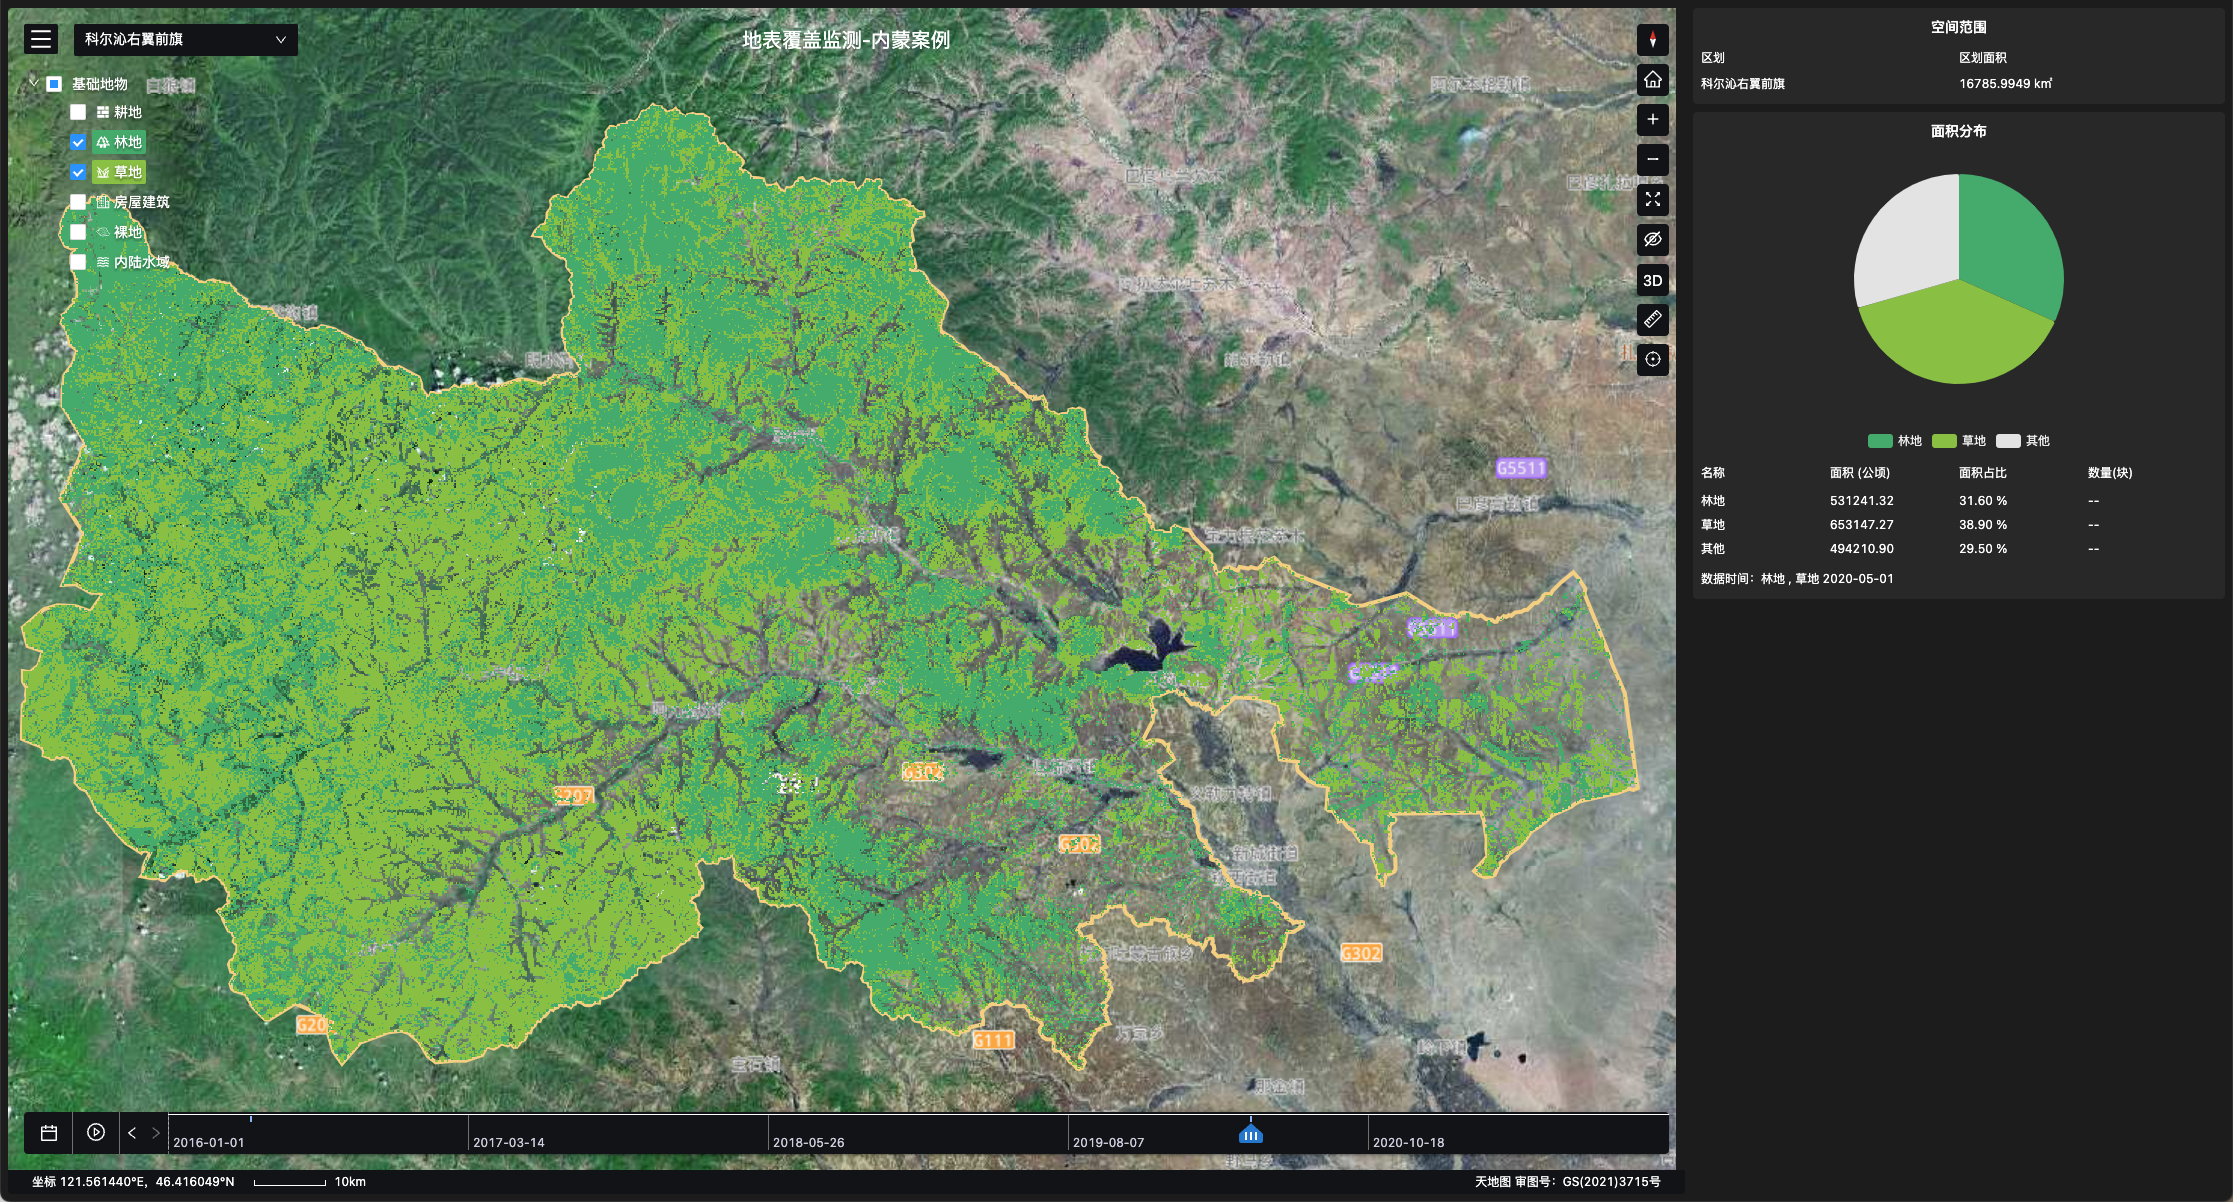
The forest and grass identification product shown above is a classic set of raster data. This product is basically a geotiff image, and for each picture element on this image represents a 10 x 10 meter square region that has a specific location on the surface (under a standardized spatial resolution).
At the same time, each picture element is given a different value according to the ground object type. When displaying at the front end, picture elements with different values are rendered in different colors, to show the distribution of forest and ground on their own. By calculating the amount of the picture elements of each type, the total areas of the forest and grassland can be calculated individually.
Vector Data
The components of vector data are “points”. These points either exist alone, to represent a single specific location, or exist in clusters, representing a polygon region with distinct location and shape. Both points and shapes can be given values to show some form of information.
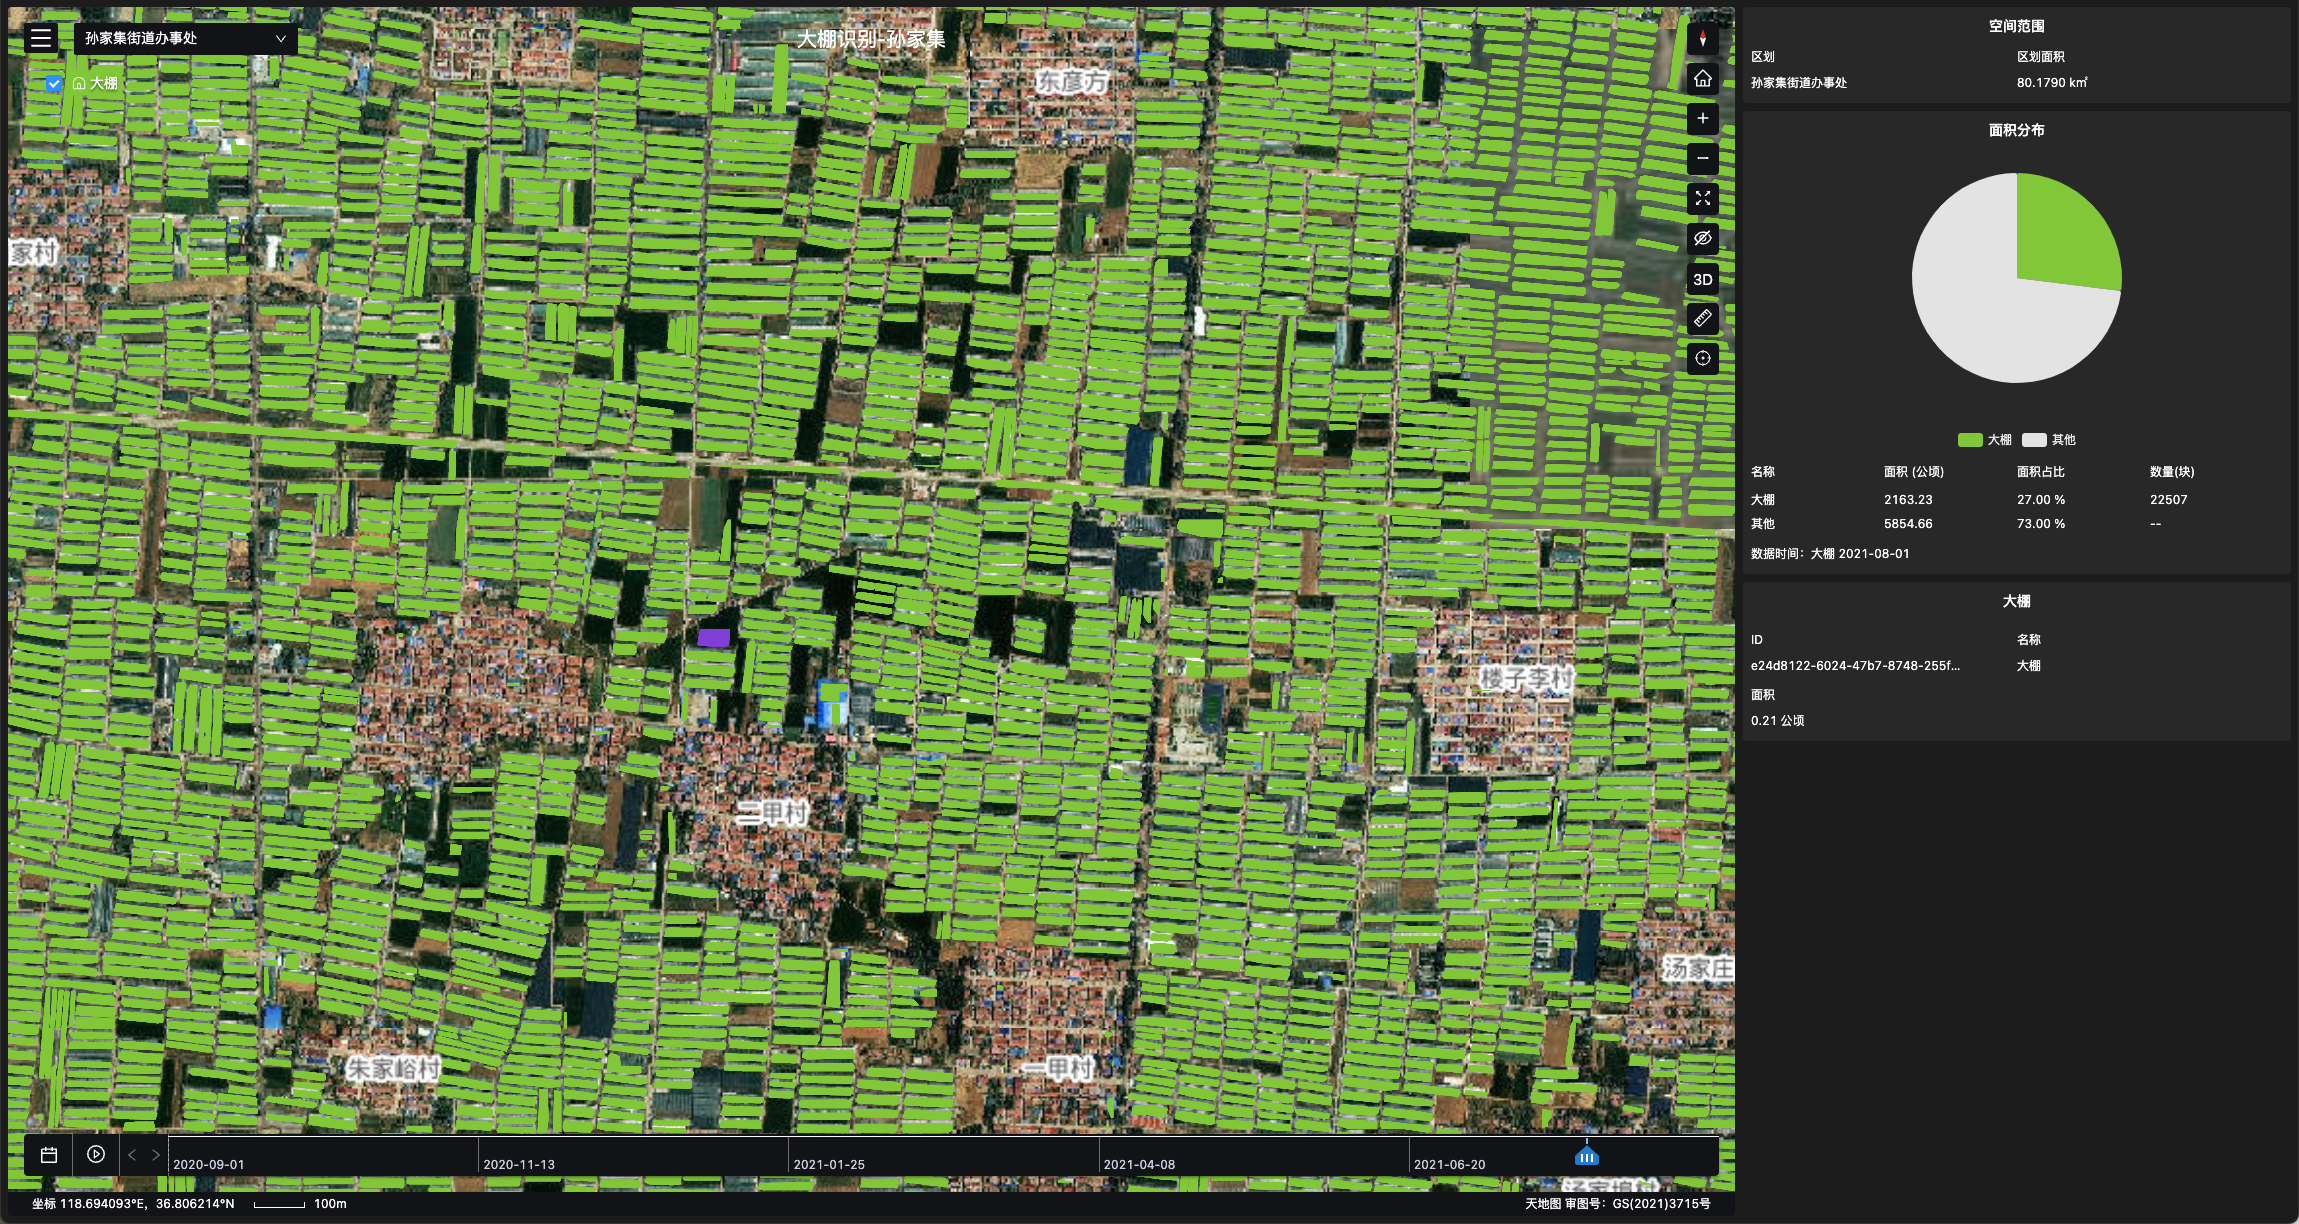
The greenhouse identification product shown above is a classical vector data product. Each small green area is a polygon constructed by one or multiple points, and each polygon in the image is given the value to represent a greenhouse.
Raster vs. Vector
In real practices, there are mainly two factors that determines if a data product should be published in the form of raster data or vector data, or both in some cases.
Specialty of Data and information that needs transferring
If a data product emphasizes on information reach some spatial granularity (such as the data needing an accuracy of 10x10 meters, or 0.5x0.5 meters on the surface), raster data would be more preferable. Examples include forest and grass distribution monitoring, monitoring of seed emergence rate, or water pollutant monitoring, etc.
If a data product emphasizes on some property of a position or a region (such as an area being the flooded zone or forest change zone), vector data would be more preferable. Examples include deforestation area monitoring, flood area monitoring, crop damage assessment at plot level, surface deformation monitoring, etc.
How data is used in applications
- If a data product is only used to display and calculate, and not to participate in interactions, raster data can be used
- If a data product is not only used in displaying and calculating but also in interactions, vector data should be used.
- Besides, in real applications, the basic conditions of the front end application also decides what form the data is going to be published in. The format of data would also be affected by the form of front end framework and whether the environment is in 2D or 3D.
Here is a quick way to understand raster and vector data 😄
Quickly Understand Raster and Vector Data
| Form | Raster Data | Vector Data |
|---|---|---|
| Basic Concept | Constructed by individual grids. Each grid represent a specific polygon location with clear size and position on the surface, and each of these grid has been given a value to represent some form of information | Constructed by “points.” These points can exist on their own to represent specific locations, or they can exist in clusters to represent a polygon area with clear size and position. These points and polygons can be given values to represent some form of information. |
| Classic Data Format | Geotiff | Geojson, Shp, KML/KMZ |
| Classic Data Product | Forest Change Type, Crop Identification at Plot Level, etc | Deforestation Monitoring, Flooded Area Monitoring, Assessment of Crop Disaster at Plot Level, Surface Deformation Monitoring, etc |
| Classic Application | Data Display and Statistics | Data Display and Statistics with Front End Interactions |
The above is a brief introduction to raster and vector data format. After defining the concept, in order to make the development as fast as possible in practical application and optimize the front-end display performance, TerraQuanta recommends that you use the standardized WMTS service. Please refer to: WMTS Layer Service